
Statistics of wind projects in the EIA process
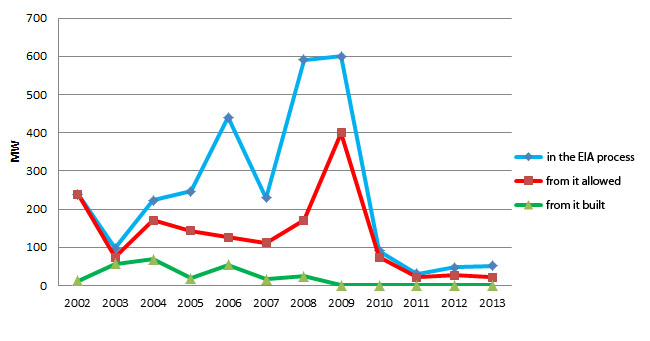
This table shows the number of wind-power plants projects, which enter into the process of assessing their environmental impact each year (EIA). Please note that the numbers that are listed in the column of the Year in the category "From it allowed" and "From it built" apply only to the projects that joined the EIA process that year, regardless of their assessment and possible construction and may have been completed in subsequent years. This means that the project, in which the EIA was initiated in 2004, the EIA was completed in 2005 and construction in 2007, is in our graph and table included only in the values listed in column 2004. In this way, it is possible to clearly separate out the success of projects, in which the EIA was initiated in different years.
| Installed power of WTGs in the EIA process in the Czech Republic | |||||||||||||
| Year | 2002 | 2003 | 2004 | 2005 | 2006 | 2007 | 2008 | 2009 | 2010 | 2011 | 2012 | 2013 | 2002-2013 |
|---|---|---|---|---|---|---|---|---|---|---|---|---|---|
| In the EIA process | 239,05 | 96,585 | 223,35 | 246,15 | 440,707 | 229,21 | 591,42 | 600,05 | 90 | 30 | 48 | 51 | 2885,522 |
| From it allowed | 239,05 | 73,235 | 169,95 | 142,75 | 126,2 | 112,11 | 170,5 | 399,6 | 74 | 21 | 26 | 21 | 1575,395 |
| From it built | 12 | 56,5 | 68,3 | 19,2 | 53,65 | 16 | 24,1 | 0 | 0 | 0 | 0 | 0 | 249,75 |
The zeros in the last column of the row "From it built" do not indicate the inability of investors to finally realize their intention, but mostly the fact that although the projects that they have passed successfully through the EIA process, were subsequently stopped or hampered in other processes and permitting procedures.
